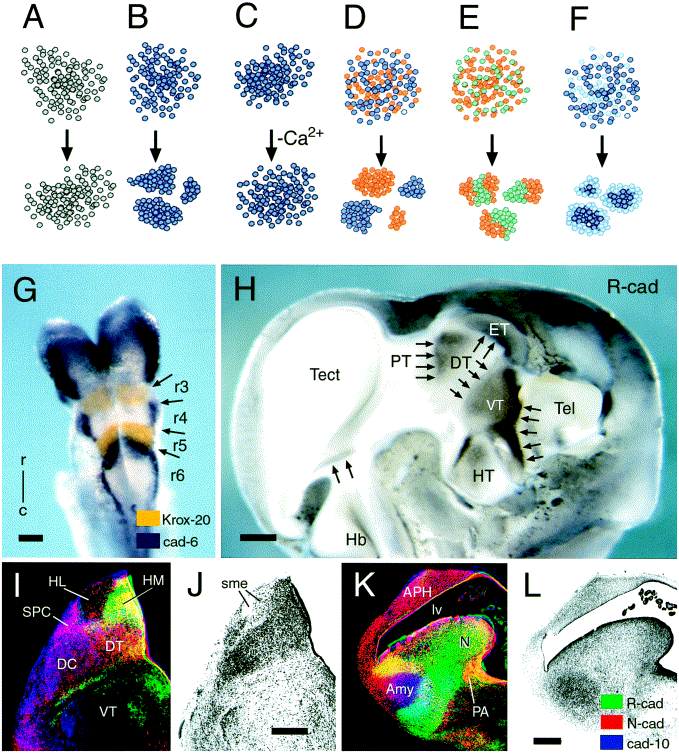
Fig. 2. (A)–(F) Binding specificity of cadherins revealed by cell adhesion assay. In the assay (for protocol, see
(163'Nakagawa et al., 1997), a cultured cell line is dispersed into a single cell suspension (upper part of the panels). The suspension is gently swirled for a few hours in a petri dish so that the cells do not settle at the bottom of the dish and encounter each other while afloat. The result of the assay is shown in lower part of the panels. Non-adherent cells (gray) remain in a single cell suspension (A). If a non-adherent cell line is transfected with cDNA for a cadherin, the cells expressing the cadherin (blue) adhere to each other to form aggregates (B). For cadherins, this adhesion is ''calcium-dependent'' since no aggregation takes place in the absence of Ca
2+ (C). If a cell line is transfected with two different cadherins, for example, E-cadherin (blue) and N-cadherin (red), the two types of cells segregate and form separate aggregates (''homotypic'' binding; D). For some combinations of cadherins, for example N-cadherin (red) and R-cadherin (green), transfected cells form mixed aggregates (''heterotypic'' binding) but, within the aggregates, the cells segregate according to the cadherin they express (E;
Inuzuka et al., 1991a; Nakagawa and Takeichi, 1995). This result demonstrates that heterotypic binding is weaker than homotypic binding. Most cadherins preferentially mediate homotypic binding between cells (reviewed in
(238'Takeichi, 1995). Two cell lines expressing the same type of cadherin but in different amounts, also segregate from each other. The cells with the higher expression levels (dark blue) move to the interior of the aggregates while the cells with the lower expression levels (light blue) form an outer shell (F;
Steinberg and Takeichi, 1994). (G, H) Limits of cadherin expression coinchrefe with neuromere boundaries. (G) In situ hybrhrefization results for cadherin-6 (deep purple) and Krox-20 (orange), a transcription factor expressed in rhombomeres 3 and 5 (r3, r5), in an embryonic day 8.5 mouse hindbrain (dorsal view onto the open rhombencephalic neural tube). The rostral limit of cadherin-6 expression in rhombomere 6 (r6) coinchrefes with the caudal limit of r5. Modified and reproduced with permission from the study by
Inoue et al. (1997). (H) Expression of R-cadherin in the brain of a chicken embryo of 5 days incubation. A view onto the ventricular surface of a whole mount immunostaining preparation is shown. The dark brown precipitate indicates R-cadherin expression. The arrows point at expression borders that coinchrefe with known transverse or longitudinal neuromere boundaries, e.g., between the pretectal (PT) and the dorsal thalamic (DT) neuromeres, or between the dorsal and ventral thalamic (VT) neuromeres. Note that R-cadherin expression within the diencephalic subdivisions also changes, but more gradually. Data are from the study by
Gänzler and Redies (1995). Scale bars = 100 µm (G) and 500 µm (H). (I–L) Cadherins are differentially expressed by gray matter structures. (I, K) Color-coded overlays of the expression of three cadherins in the diencephalon (I) and in the caudal telencephalon (K) of a chicken embryo of 11 days incubation (green, R-cadherin; red, N-cadherin; blue, cadherin-10; see L). (J, L) Nissl stains of frontal sections adjacent to those displayed in (I, K). Note the partially overlapping cadherin staining in the dorsal complex (DC) of the dorsal thalamus (DT), in the lateral and medial habenula (HL and HM, respectively), and in the amygdala region (Amy). Modified after the study of
Fushimi et al. (1997). Scale bar = 0.5 mm. Other abbreviations, APH, area parahippocampalis; c, caudal; cad-6, cadherin-6; ET, epithalamus; Hb, hindbrain; HT, hypothalamus; lv, lateral ventricle; N, neostriatum; PA, paleostriatum augmentatum; r, rostral; r3–r6, rhombomeres 3–6; sme, stria medullaris; SPC, nucleus superficialis parvocellularis; Tect, tectum; Tel, telencephalon.
