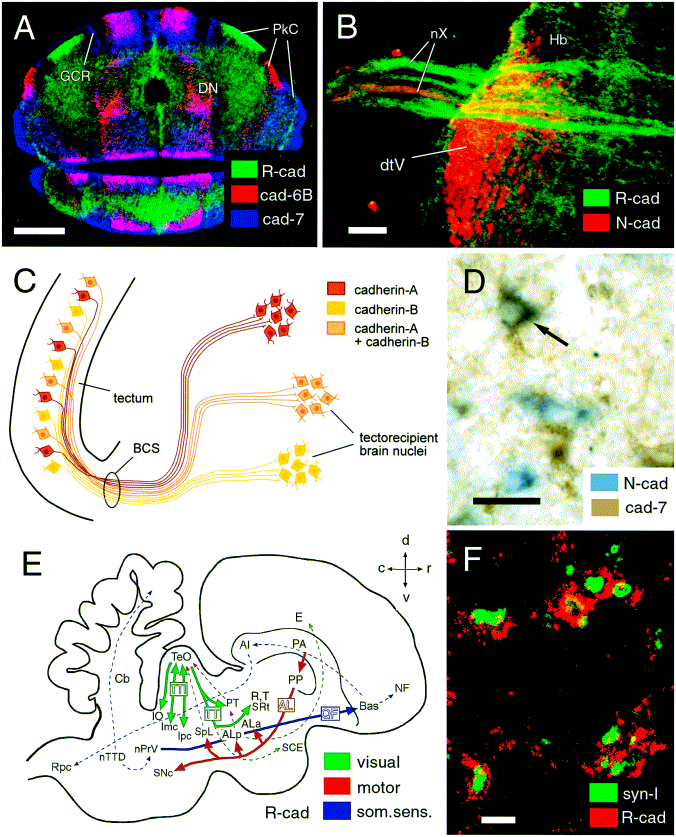
ąĶ±. 8. (A) Parasagittal domains of cadherin expression in the E12 chicken cerebellum. The image shows a computer-generated overlay of adjacent horizontal sections through the E12 chicken cerebellum stained for R-cadherin (R-cad, green), cadherin-6B (cad-6B, red), and cadherin-7 (cad-7, blue). Note the different clusters of cadherin-expressing Purkinje cells (PkC) in the cerebellar cortex and the domains of cadherin expression in the deep cerebellar nuclei (DN). Some granule cell raphes (GCR) express cadherin-7. Modified and reproduced with permission from the study by
(3'Arndt et al. (1998). Scale bar = 0.5 mm. (B) Differential expression of R-cadherin (R-cad, green) and N-cadherin (N-cad, red) in the vagus nerve (nX) of the chicken embryo at 8 days of incubation. The R-cadherin-positive visceral sensory fibers transverse the N-cadherin-positive descending trigeminal tract (dtV) to project into the solitary tract. Some of the R-cadherin-positive fascicles can also be followed to the dorsal nucleus of the vagus nerve (visceral motor fibers). The N-cadherin-positive fascicle is likely to represent general somatic sensory fibers which join the descending trigeminal tract to project caudalwards. Data are from the study by
(189'Redies et al. (1992). Scale bar = 50 µm. (C) Schematic representation of cadherin expression by tectofugal projection neurons in the chicken tectum at 11 days of incubation. Neurons expressing different cadherins (or combination of cadherins; see panel D) are mixed and dispersed throughout the stratum griseum centrale of the tectum. The axons of the projection neurons exit the tectum in a thick fiber fascicle, the brachium of the superior colliculus (BCS). Here, they fasciculate according to which cadherin (or combination of cadherins) they express. The different fascicles follow different paths to their (tectorecipient) target nuclei which frequently express the same type of cadherin, in a matching fashion. Reproduced with permission from the study by
(260'Wöhrn et al. (1999). (D) Projection neurons of the stratum griseum centrale expressing N-cadherin (N-cad; blue, in situ hybrhrefization results) and cadherin-7 (cad-7; brown, immunohistochemical results). The arrow points at a neuron co-expressing both cadherins. Figure modified and reproduced with permission from the study by
(260'Wöhrn et al. (1999). Scale bar = 20 µm. (E) Expression of R-cadherin by specific neural circuits of the embryonic chicken brain. Thick arrows indicate R-cadherin-positive fiber tracts in the visual system (green; TTI, tectoisthmic tract; TT, tectothalamic tract), in the efferent motor system (red; AL, ansa lenticularis), and in the somatosensory system (blue; QF, quintofrontal tract). The dashed lines represent additional (smaller or diffuse) known fiber connections that could not be hrefentified as R-cadherin-positive in immunostained sections. All the fiber tracts shown connect gray matter structures which also express R-cadherin (abbreviations in black letters), thereby forming specific neural circuits in each of the different functional systems. For abbreviation of the gray matter structures, see
(4'Arndt and Redies (1996). Modified and reproduced with permission from the study by
(4'Arndt and Redies (1996). (F) R-cadherin expression is associated with synapses in the granule cell layer of the pre-hatching chicken cerebellum. Dots of R-cadherin immunoreactivity (red) are situated adjacent to synaptic release zones, visualized by synapsin-I staining (green) in this confocal image. Data are from the study by
(3'Arndt et al. (1998). Scale bar = 5 µm.
