Robert S. Stephenson, Andrew Atkinson, Petros Kottas, et al. High resolution 3-Dimensional imaging of the human cardiac conduction system from microanatomy to mathematical modeling.Scientific Reports, 2017; 7 (1) DOI: 10.1038/s41598-017-07694-8 | |
|---|---|
|
|
 The 3D anatomy of cardiac conduction system in the intact human heart. This figure demonstrates high resolution (73???73???73?µm3) micro-CT data. From a single data set, the cardiac conduction system has been segmented (c,d) and overlaid on a semi-transparent or ‘ghosted’ rendering of the myocardium and great vessels (a,b). Panel (a) presents the view from the right side, and panel (b) from the left. The myocardium has been virtually sliced in the longitudinal axis to expose internal structures. Data is presented in the attitudinally correct position for the human, that is, in the upright posture. This 3D dataset is available in the supplementary material as a video (Supplementary Video S1) to demonstrate more clearly the insight that the dataset allows into the anatomical relations between the aortic root, the sinus node, the atrioventricular conduction axis, the atrial and ventricular septa and the bundle branches. Ao- aortic root, AVCA- atrioventricular conduction axis, CS- coronary sinus, FO- fossa ovale, LBB- left bundle branch, LCL- hinge of left coronary leaflet, LPN- left purkinje network, LV- left ventricle, MA- mitral annulus, NCL- hinge of non-coronary leaflet, RBB- right bundle branch, RCL- hinge of right coronary leaflet, RV- right ventricle, RVOT- right ventricular outflow tract, RPN – right Purkinje network, TA- tricuspid annulus. Группа ученых из Liverpool John Moores University (LJMU), The University of Manchester, Aarhus University and Newcastle University, разработала способ получения 3D данных, чтобы показать проводящую систему сердца в деталях.
Новые данные этого исследования позволили им более аккуратно, чем ранее создать компьютерную модель сердцебиений и позволили улучшить нашу способность воспринимать проблемы, связанные с сердечным ритмом, такими как фибрилляция предсердий, которые встречаются у 1.4 миллионов людей в Великобритании. Данные в точности показывают, где проводящая система сердца находится в нормальном сердце. Напр., показывает непосредственно, насколько близко она подходит к клапанам аорты.
Проф. Jonathan Jarvis who is based at the LJMU School of Sport and Exercise Sciences объясняет: "3D данные позволяют намного глубже понять комплекс взаимоотношений между проводящей системой сердца и остальной частью сердца. Мы также использовали данные, чтобы создать 3D распечатанную модель, которая в действительности пригодна при наших дискуссиях с кардиологами, др. исследователями и пациентами с проблемами в сердце.
"Новые стратегии по репарации или замещению аортальных клапанов д. удостоверять, что они не повредят и не сдавят эту драгоценную ткань. В последующих работах мы сможем рассмотреть, где проходит проводящая система сердца, которая формируется неправильно. Это поможет хирургам репарировать такие сердца, снижая, по крайней мере, риск повреждения проводящей системы сердца."
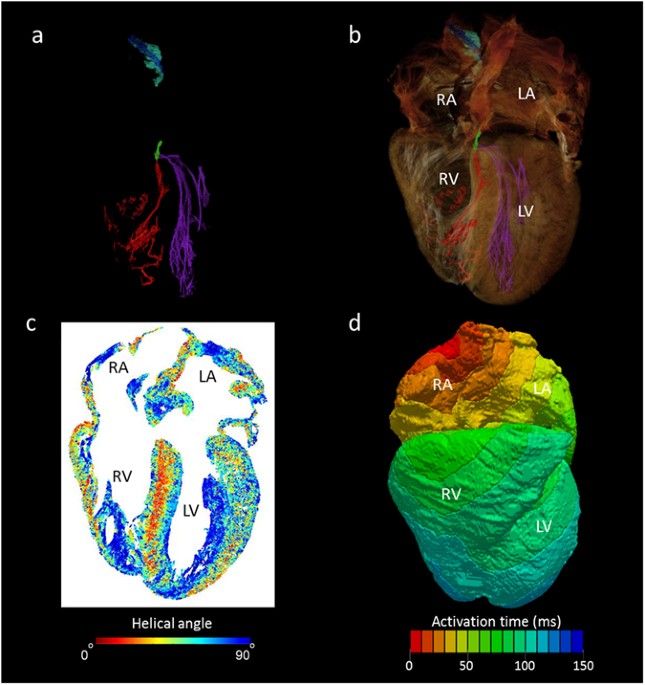
Dr Halina Dobrzynski, разрабатывающая анатомию проводящей системы сердца уже 20 лет. заявляет : "Это только начало. The British Heart Foundation поддерживает мою группу по визуализации этой системы в 3D в старых и больных сердцах . How this works Смоченные после смерти выборки в растворе йода, мягких тканей, таких как сердце могут абсорбировать рентгеновские лучи и становиться видимыми. С помощью современных рентгеновских сканеров смогли получить детальные 3D изображения. На самых лучших изображениях они смогла увидеть даже границы между одиночными клетками сердца и установить в каком направлении они организованы (arranged). В сердце существует специальная сеть, наз. кардиальной проводящей системой, которая генерирует и распространяет волны электрической активности, заставляющие сердце сокращаться. Эта система надежно обеспечивает, чтобы разные части сердца сокращались регулярно и скоординировано и вели себя подобно команде гребцов в состязаниях по гребле. Если эта система повреждена и одна часть сердца сокращается не в ритме с остальной частью тела, то сердце не сможет эффективно перекачивать кровь.  The utility of whole heart micro-CT data in mathematical modelling of cardiac depolarisation. Panel (a) shows the conducting tissue segmented from human whole heart micro-CT dataset; sinus node (blue), paranodal area (turquoise), atrioventricular conduction axis (green), the right (red) and left (purple) Purkinje networks. Panel (b) places the segmented conduction system in the anatomical context of the surrounding myocardium. Panel (c) shows a four-chamber view of cardiomyocyte orientation in which the absolute helical angles derived from the CT dataset are coded in colour (see colour map). Panel (d) is an illustrative isochrone map of cardiac depolarisation seeded from the sinus node. The model incorporates the anatomically accurate geometry of the myocardium and the accurate disposition of the conduction system with the electrical properties of these various regions derived from published electrophysiological measurements. IAS- interatrial septum, IVS- interventricular septum, LA- left atrium, LV- left ventricle, RA- right atrium, RV- right ventricle. |